Alarms General
Overview
Alarms define an undesirable state for either all or a subset of the assets in your portfolio. These alarms are displayed throughout the platform: on the alarm page, in various tables, and as alarm cards.
An alarm by itself does not trigger an action. To execute actions based on alarm status (active/inactive), you need to set up a watchdog. See Watchdogs for details.
The web portal tooling facilitates configuring alarms which cover a large number of assets, rather than on a per asset basis.
The system comes with preconfigured defaults (Defaults). You are free to remove these, edit them, or add new alarms to suit your unique needs.
Supported Alarm Types
The following alarms are currently supported:
- No data: Triggered when a signal has not received any updates for a defined period.
- Low delta: For counter signals (e.g., energy, gas, water meters). Triggered when the counter’s increase over a period remains below a threshold.
- Low performance ratio: Triggered when the calculated performance ratio (PR) of a production asset remains below a threshold.
- Low uptime: Triggered when the calculated uptime of a production asset remains below a threshold.
Alarm Configuration
Navigating to the Alarm Settings
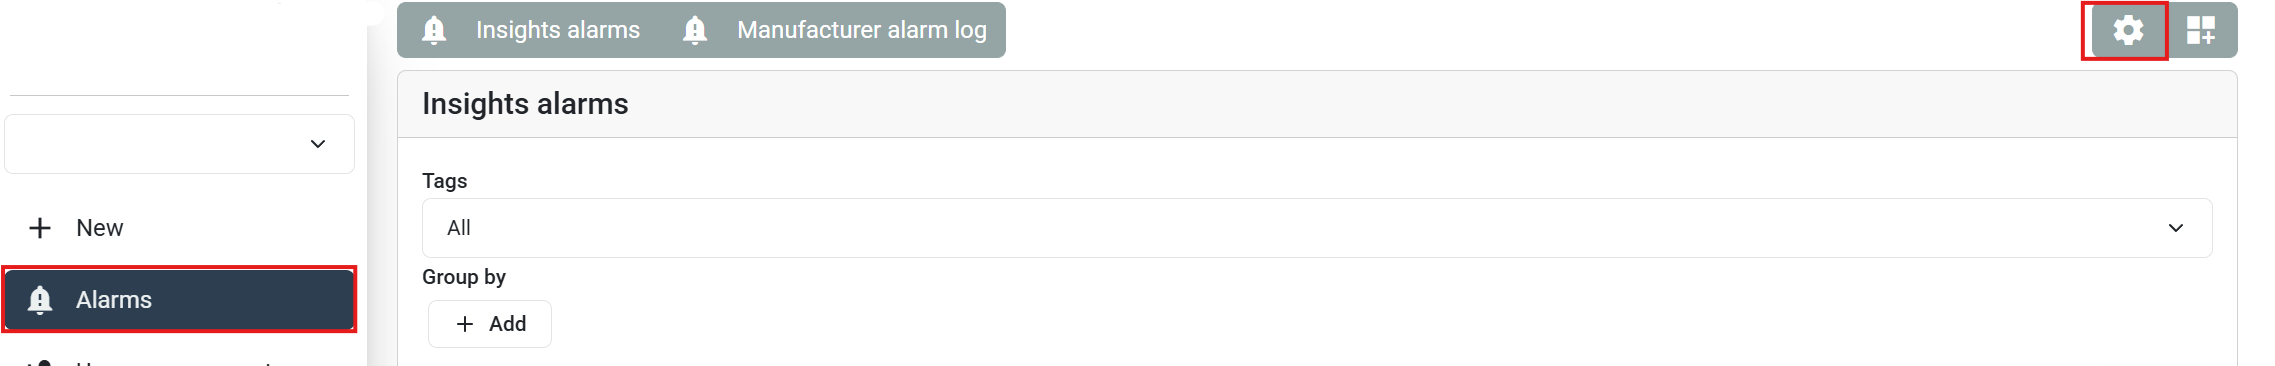
Alarms can be configured by navigating to the alarms page and clicking on the gear icon in the upper right corner.
Creating and Editing Alarms
The alarm edit page will present you with an overview of all existing alarms, as well as an input form to set up a new alarm.
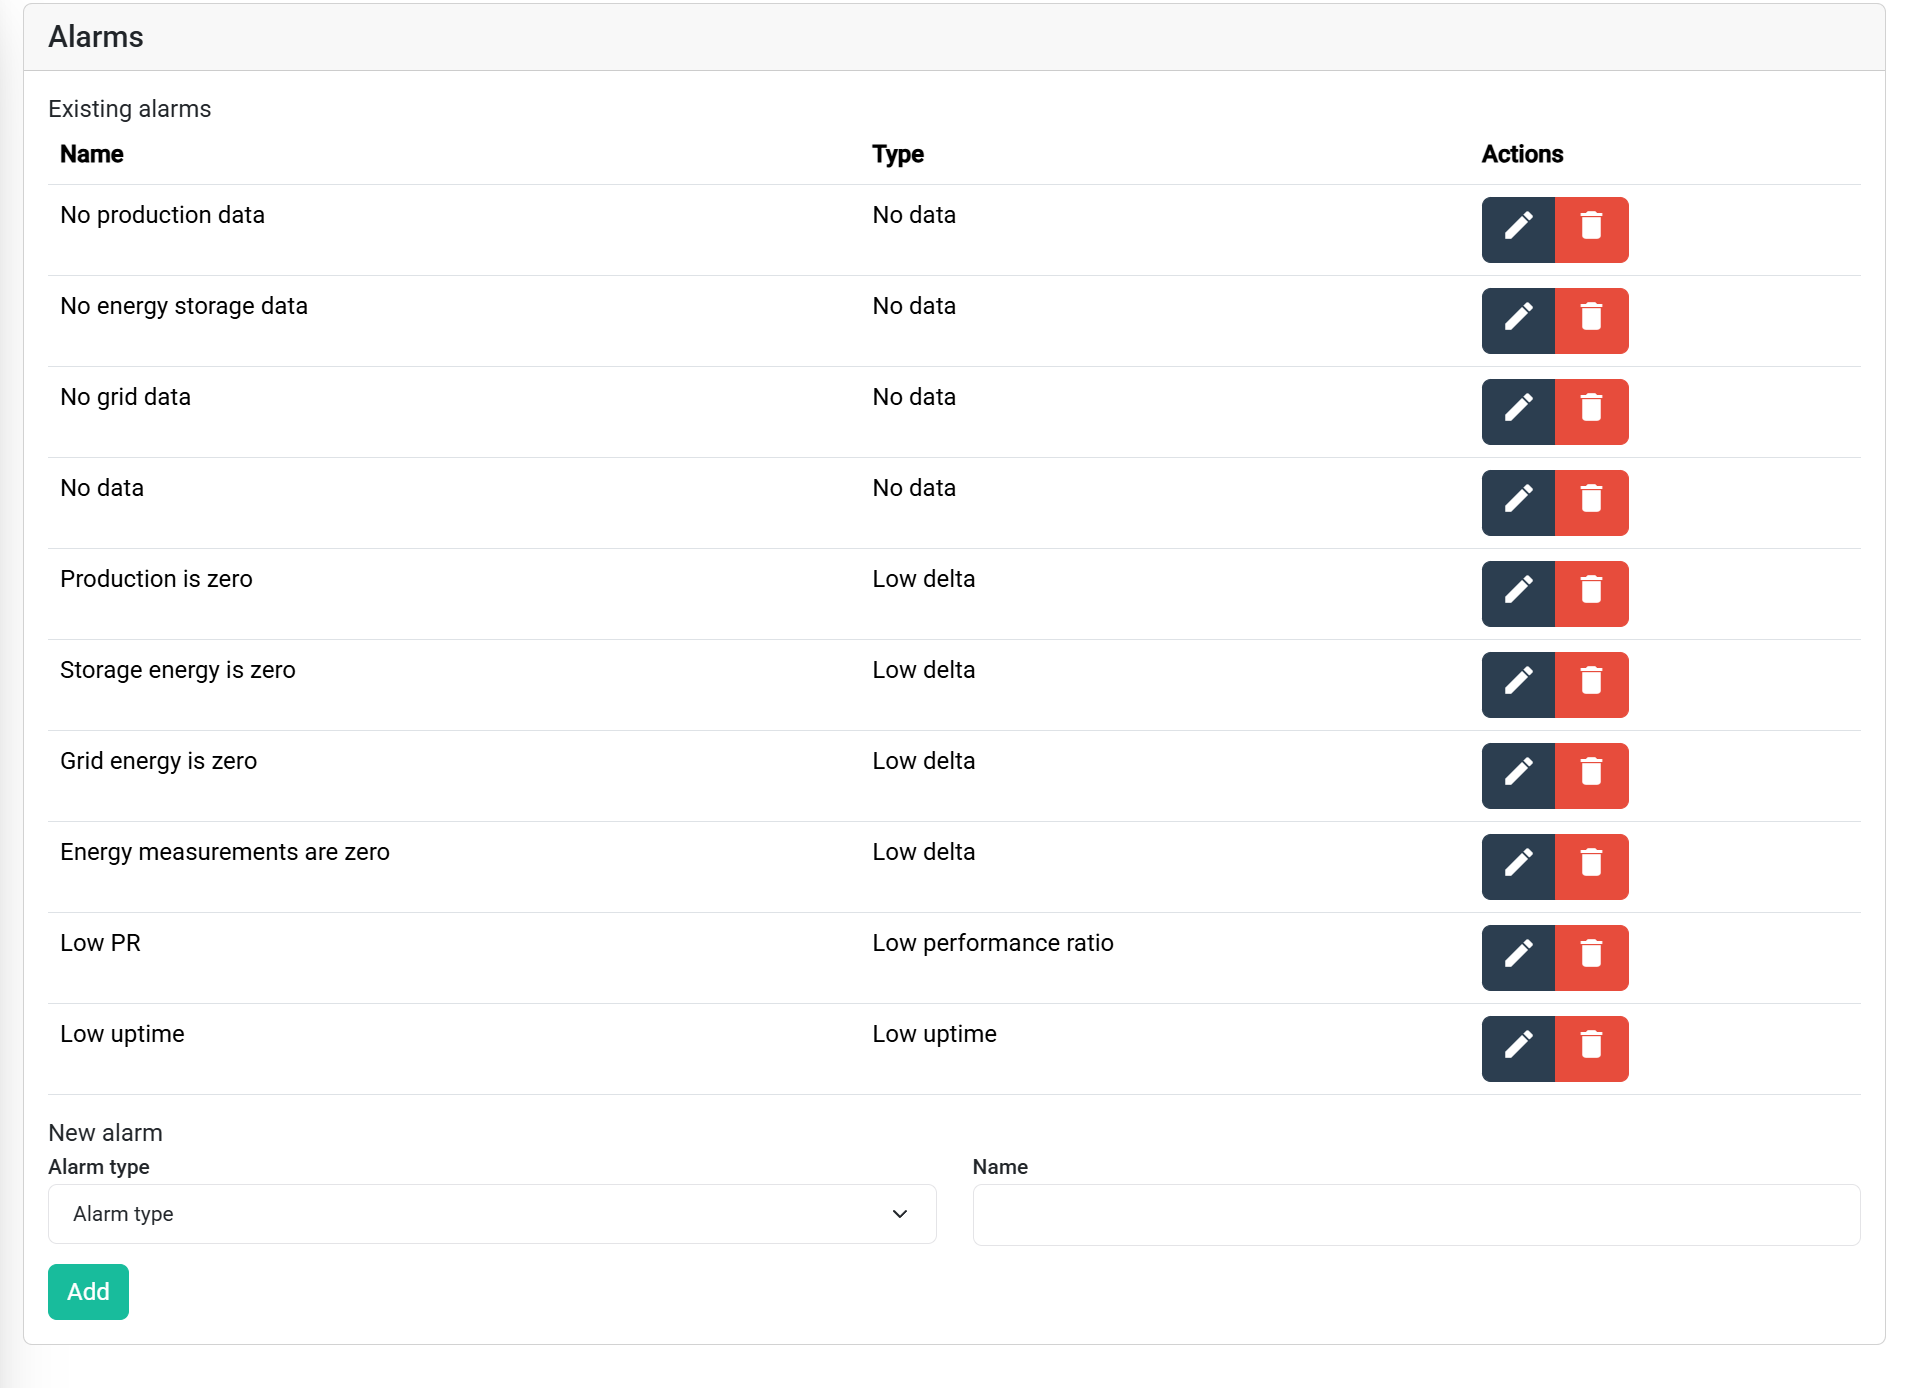
An existing alarm can be edited by clicking on the pencil icon.
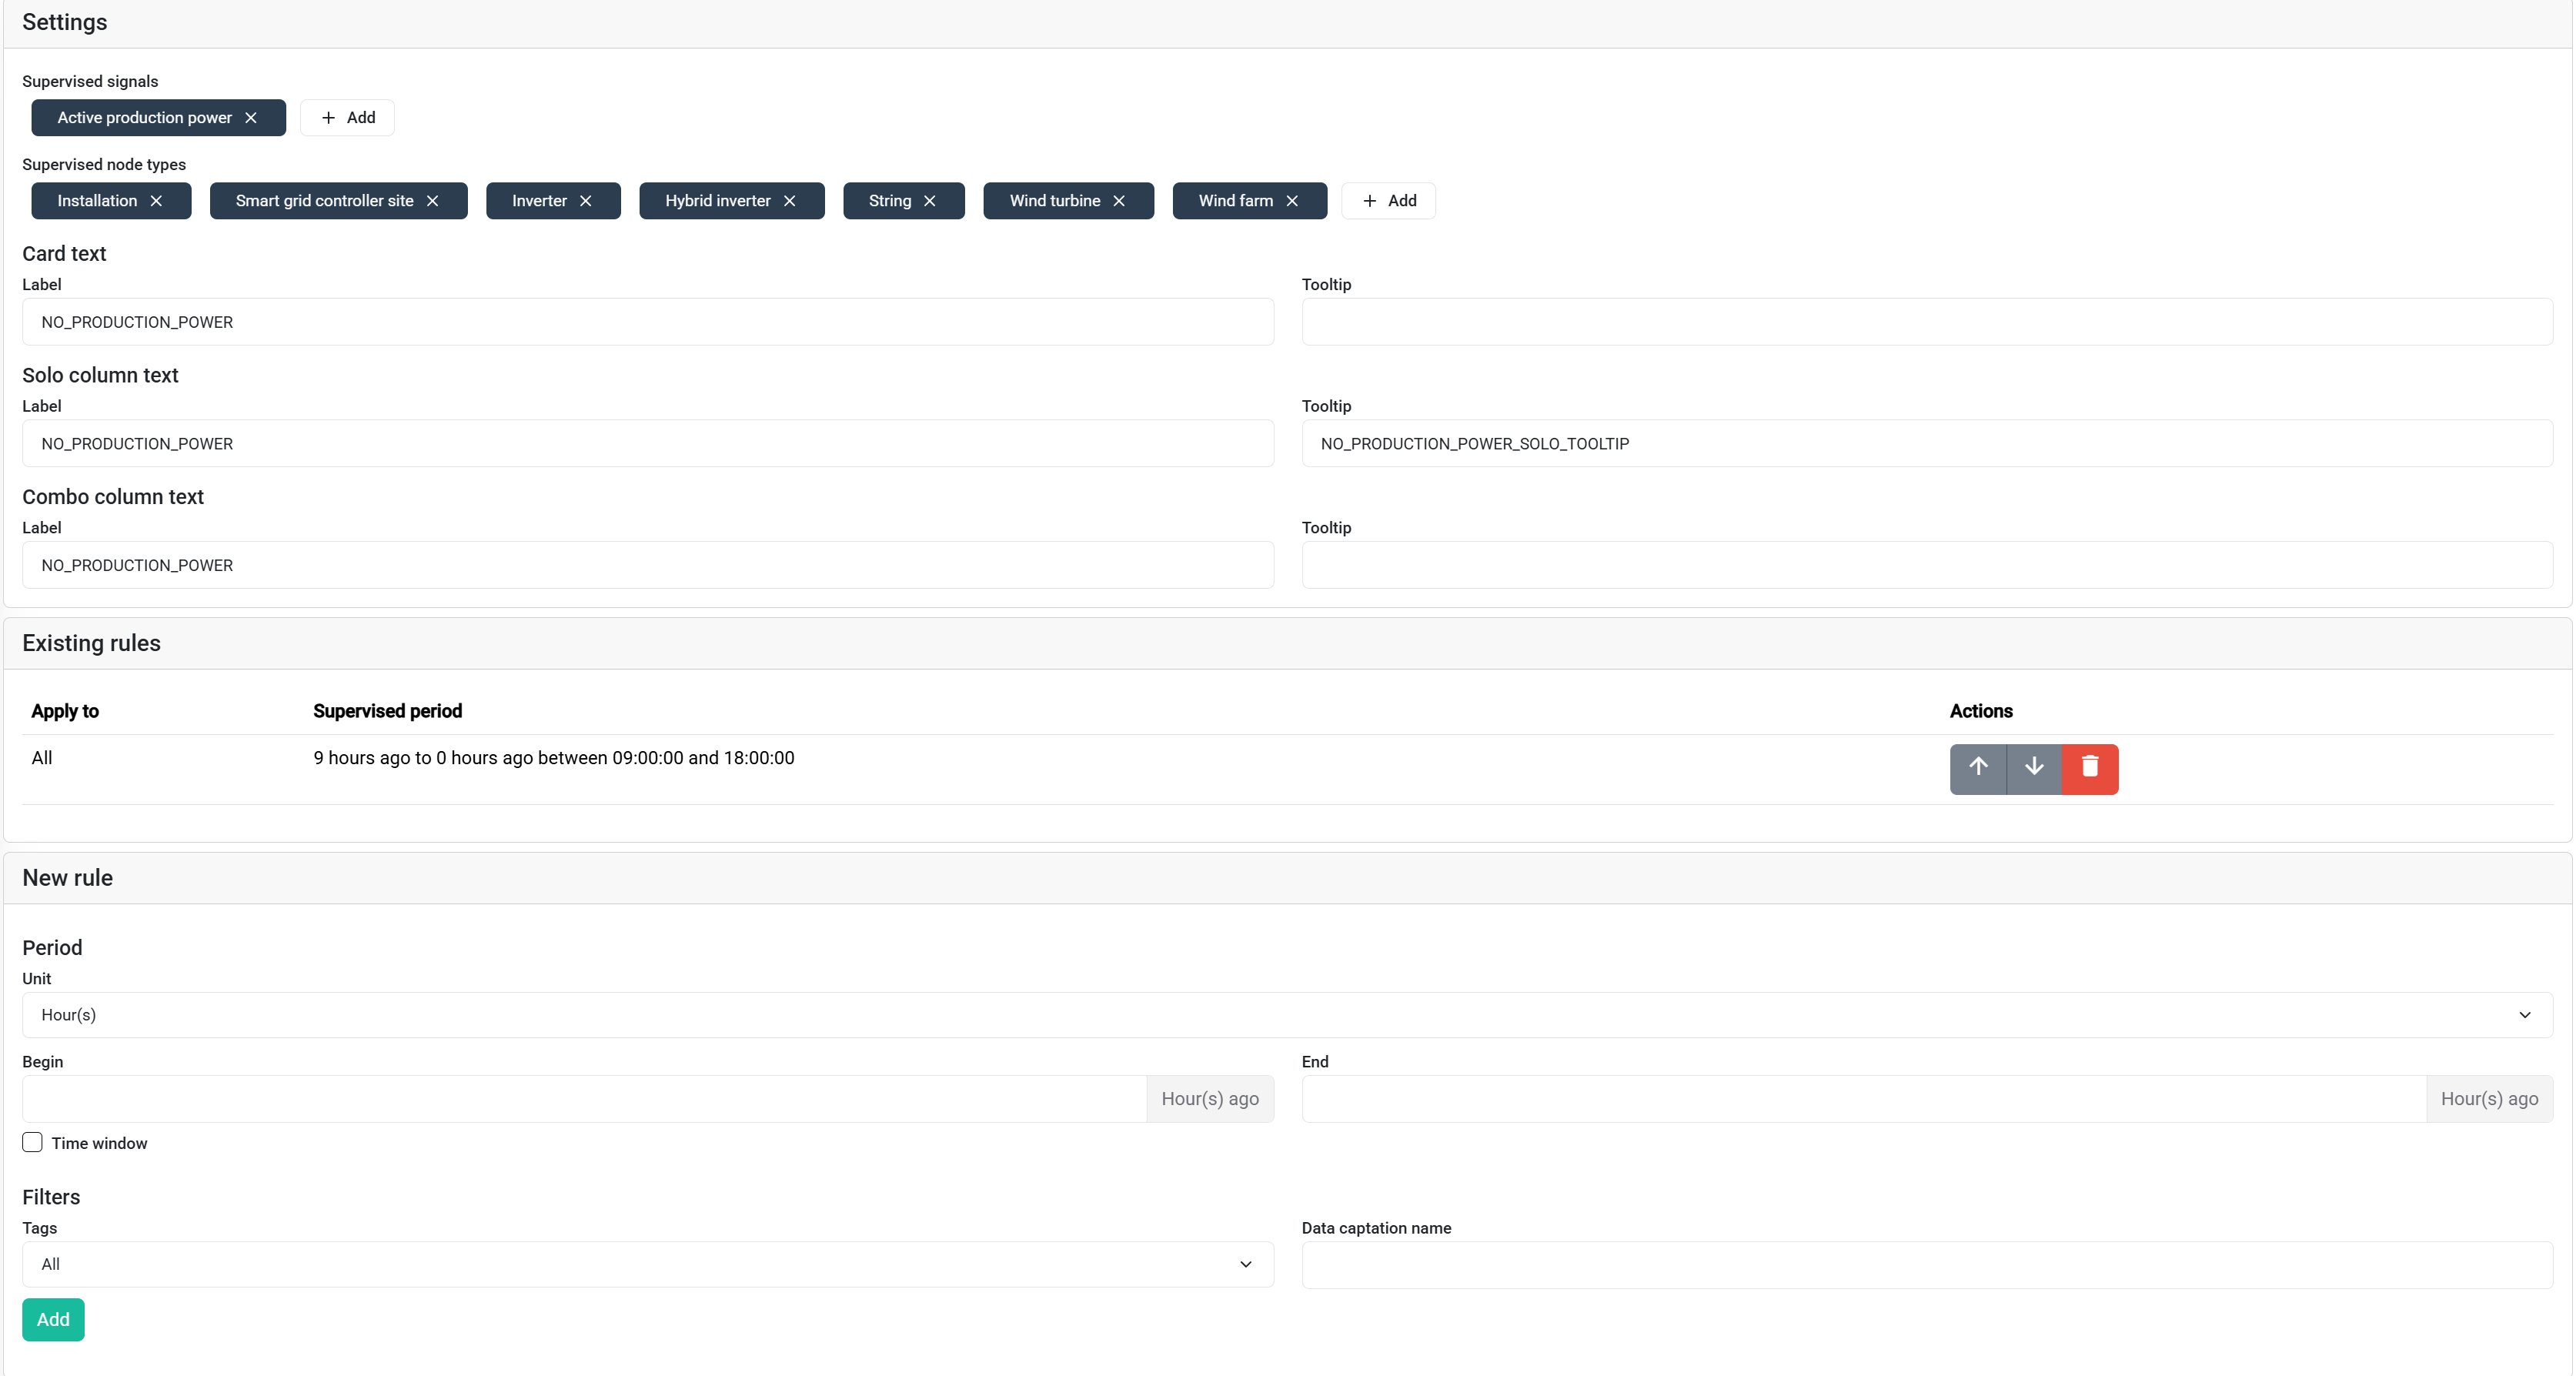
The following screenshot shows the settings of a no data alarm. While this is a specific type of alarm, most alarms have similar settings and these are representative.
Alarm Rule Logic
General settings
The general settings of the alarm specify:
- Which signals should be monitored.
- For which asset types the signal must be monitored.
- The display text for the alarm in different contexts (card, table column, combined column).
The example image shows an alarm defined for installations, smart grid controller sites, inverters, etc., supervising the active production power signal. Alarm text can be translated via the translations page.
Matching Rules and Order
The existing rules section specifies which alarm parameters (like thresholds and time periods) are applied to which assets. Any asset matching the monitored node types will be evaluated against each rule from top to bottom. Rules can be restricted to assets with specific tags or data captation methods.
It's common for different data sources to have varying delays. For instance:
- A SolarLog installation might upload data via FTP only once daily.
- A Smart Grid Controller might be expected to send data hourly.
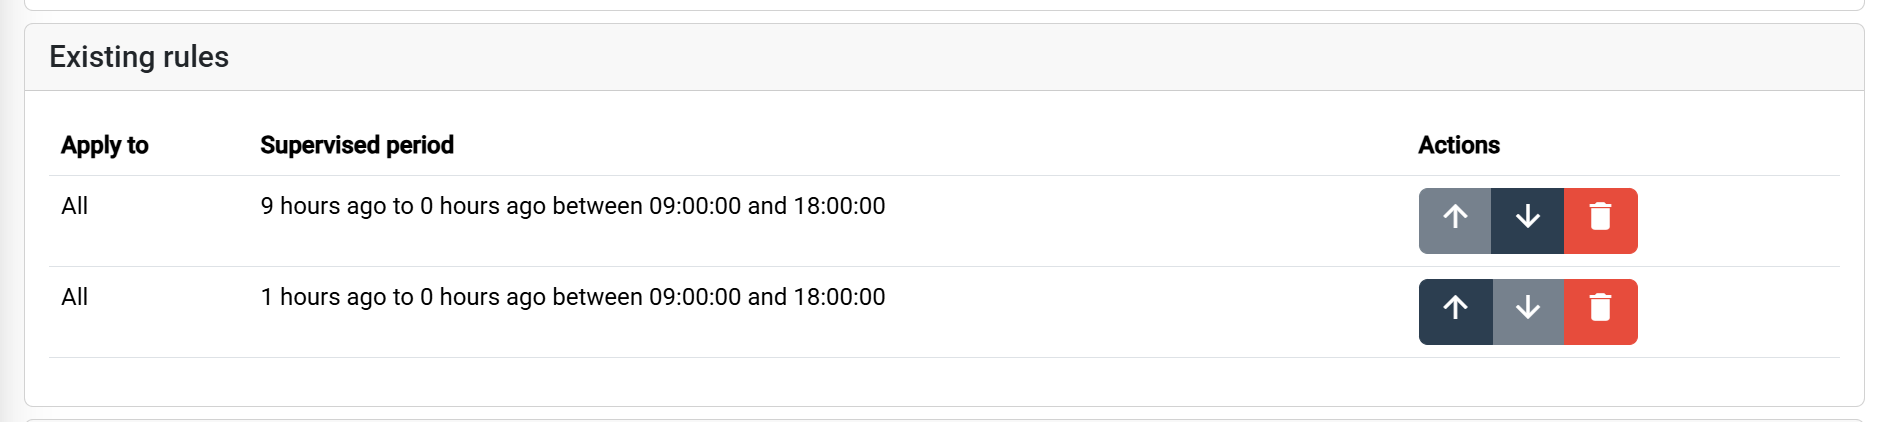
The rules in the image apply a default No data delay of 1 hour, but a specific rule for SolarLog FTP triggers only after 9 hours of no data.
Only the first matching rule is applied to each asset. This means the order of rules is crucial. Place the most specific rules (e.g., targeting a specific tag or data source) before more general rules.
Alarm Periods and Time Windows
Each alarm rule defines a lookback period — a relative time window over which the alarm condition is evaluated. This is specified using a start and end offset from the current time (e.g., "0 hours ago" to "1 hour ago"). Within this window, the system checks if the signal data meets the alarm condition.
For assets that are inactive during certain times (like solar assets at night), a time window can restrict the alarm calculation to specific hours of the day (in the asset’s local timezone).
The SolarLog FTP alarm example uses a 9-hour lookback period with a time window from 09:00 to 18:00.
If checked at 13:15:
- The system looks back 9 hours within the active time window.
- This translates to checking for data between 09:00 and 13:00 today (4 hours within the window).
- And checking for data between 13:00 and 18:00 yesterday (5 hours within the window to complete the 9-hour lookback).
- An alarm triggers only if data is missing from both intervals.